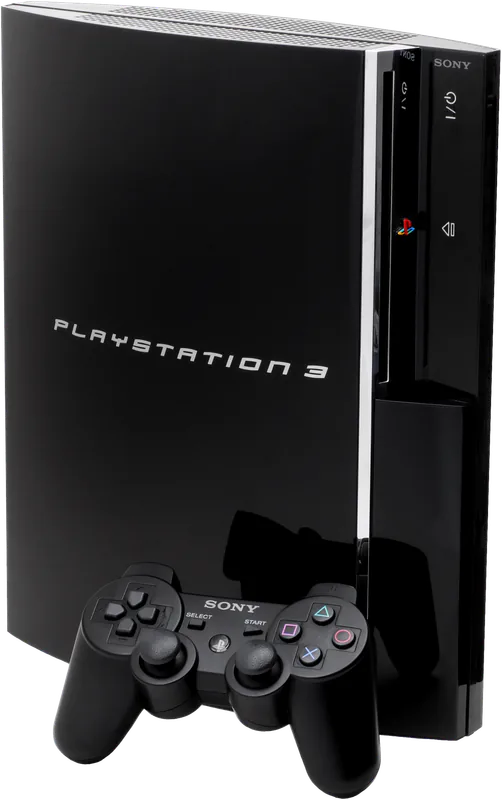
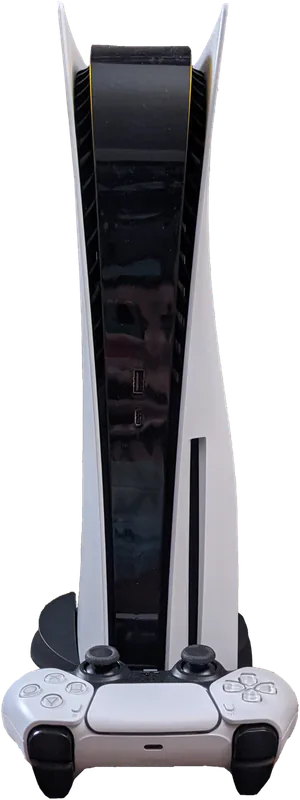
The race from launch day
Cumulative units by months since each console's own launch. Figures between reports are modelled; where reports are years apart, the line is a rough approximation, not observed annual sales.
Side by side
| PS3 | PS5 | |
|---|---|---|
| Cumulative units (estimated) | 87,400,000 | ≈ 98,117,518 |
| After 5y 11m on sale | ≈ 69.3M | ≈ 97.6M |
| Released | November 11, 2006 | November 12, 2020 |
| Time on the market | 10y 4m | 5y 11m |
| Average per day | ≈ 23K | ≈ 45K |
| Status | Discontinued | On sale |
More comparisons
Frequently asked questions
Which sold more, the PlayStation 3 or the PlayStation 5?
As of October 31, 2026, the PlayStation 5 leads our tracked comparison: about 98.1 million units against 87.4 million for the PlayStation 3, a gap of 10.7 million. Figures may mix reported shipments, customer sales and estimates.
How many PlayStation 3 and PlayStation 5 consoles have been sold?
PlayStation 3: 87.4 million units as of March 31, 2017 (Sony annual results, fiscal year to March 2017; measurement not specified). PlayStation 5: more than 95 million units as of June 30, 2026 (Sony Interactive Entertainment, sell-in (units shipped)); our model uses an approximately 95.3 million anchor calculated from rounded reports.
Figures can measure shipments, customer sales or estimates; these are not directly interchangeable. Between reports our model projects an estimate, not observed transactions. The changing digits show the model's output, not its accuracy. Its inputs and assumptions are corrected when new figures are available. Sources and method